jrquist
New member
- Joined
- Jul 31, 2018
- Messages
- 3
- Reaction score
- 0
- Points
- 0
- Excel Version(s)
- 2016 MSO 32 bit
Hi guys, I am having a heck of a time making a chart to suit my needs. I sure hope someone out there can help!
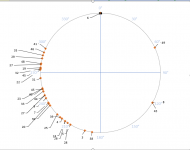
I'm looking to create a polar chart that looks like a compass (360 degrees) where I can have a list of values in Excel representing different angle measurements taken (angles or radians) and a label for each. So, for example:
Reading# Degrees
1 42
2 113
3 145
4 189
5 305
I got the polar plot plug in by Andy Pope. But, it includes a distance measurement and well as "Top left cell of Output range" which I simply do not understand...
Again, all I am looking for is a compass image where the values show up as tick marks on the outer circle and include a tag like "Reading #1".
Any help is greatly appreciated. I'm a noob with Excel. So glad to find this site.
Cheers, Juliana


