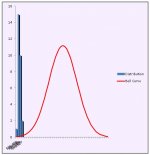
I have a rather large vba application written for excel to generate assorted reports on SPC data. My histogram chart broke beginning with version 2007. Same code, different results. I am unfortunately not an excel guru so I'm hoping someone here might be able to tell me why this code that works in all versions of excel prior to version 2007 no longer works. Below is the code and screencaptures from versions 2003 and 2010.
Thanks,
Robb
[FUNCTION THAT CREATES THE CHART]
[SNIPPET OF THE COLLECTED DATA (there are 50 values in the Bell Curve)]

[RESULTS IN EXCEL PRIOR TO VER 2007]

[RESULTS IN EXCEL 2010]

Thanks,
Robb
[FUNCTION THAT CREATES THE CHART]
Code:
Private Function ChartHistogram(data As DataStruct_, ByVal StartR As Long, ByVal StartC As Long) As ChartObject
Dim NumGroups As Integer, PlottedPointsCount As Long
Dim R As Long, C As Long
Dim I As Integer

'########################################################
'#                CREATE HISTOGRAM CHART                #
'########################################################
    Charts.Add
    ActiveChart.ChartType = xlColumnClustered
    ActiveChart.Location Where:=xlLocationAsObject, Name:=SPC_RS.Name
    Set ChartHistogram = ActiveSheet.ChartObjects(ActiveSheet.ChartObjects.Count)


'ADD SERIES DATA(LINES)
    R = StartR
    C = StartC
    NumGroups = Val(txtDivisions)
    PlottedPointsCount = UBound(data.BellCurvePoints)

On Error Resume Next
    For I = 1 To ActiveChart.SeriesCollection.Count
        ActiveChart.SeriesCollection(I).Delete
    Next I

    ActiveChart.SeriesCollection.NewSeries
    ActiveChart.SeriesCollection(1).Name = "=""Distribution"""

' Mark added the next two lines for histogram range values
    ActiveChart.SeriesCollection(1).XValues = "='" & SPC_DS.Name & "'!R" & R & "C" & C & ":R" & R + NumGroups - 1 & "C" & C
    C = C + 1

    ActiveChart.SeriesCollection(1).Values = "='" & SPC_DS.Name & "'!R" & R & "C" & C & ":R" & R + NumGroups - 1 & "C" & C

 ' Mark added these lines for display enhancement
    ActiveChart.SeriesCollection(1).Shadow = True
    'ActiveChart.SeriesCollection(1).Border.Color = vbBlue
    ActiveChart.ChartGroups(1).GapWidth = 15
    ActiveChart.Axes(xlCategory).Select
    Selection.TickLabels.Orientation = 35
    Selection.TickLabels.NumberFormat = "0.000"

    C = C + 1
    ActiveChart.SeriesCollection.NewSeries
    ActiveChart.SeriesCollection(2).Name = "=""Bell Curve"""
    ActiveChart.SeriesCollection(2).Values = "='" & SPC_DS.Name & "'!R" & R & "C" & C & ":R" & R + PlottedPointsCount - 1 & "C" & C
    ActiveChart.SeriesCollection(2).Border.Color = vbRed
    ActiveChart.SeriesCollection(2).ChartType = xlLine

'Selection
    With ActiveChart
        .HasAxis(xlCategory, xlPrimary) = True
        .HasAxis(xlCategory, xlSecondary) = True
        .HasAxis(xlValue, xlPrimary) = True
        .HasAxis(xlValue, xlSecondary) = False
    End With

'Remove Gridlines
    With ActiveChart
        .Axes(xlCategory).HasMajorGridlines = False
        .Axes(xlCategory).HasMinorGridlines = False
        .Axes(xlCategory, xlSecondary).MajorTickMark = xlNone
        .Axes(xlCategory, xlSecondary).MinorTickMark = xlNone
        .Axes(xlCategory, xlSecondary).TickLabelPosition = xlNone
        .Axes(xlValue).HasMajorGridlines = False
        .Axes(xlValue).HasMinorGridlines = False
    End With

'FINAL TOUCHES
    ActiveChart.ChartArea.Interior.Color = xlAutomatic
    ActiveChart.PlotArea.Interior.Color = xlAutomatic
    ActiveChart.Legend.Interior.Color = xlAutomatic
    ActiveChart.HasTitle = True
    ActiveChart.ChartTitle.Characters.Text = "Histogram"

    ActiveChart.Axes(xlValue).CrossesAt = ActiveChart.Axes(xlValue).MinimumScale
    ActiveChart.Axes(xlCategory).CrossesAt = ActiveChart.Axes(xlCategory).MinimumScale

End Function
[SNIPPET OF THE COLLECTED DATA (there are 50 values in the Bell Curve)]

[RESULTS IN EXCEL PRIOR TO VER 2007]

[RESULTS IN EXCEL 2010]


