Hello,
I am using PowerQuery to migrate data from one database into another. To make a long story short, the requirements of this migration are:
1) The existing database can only export to .csv files
2) The new database uses a "flat file importer" to import data, and the flat files (.csv) must be of a very specific format and contain data not present in the original database
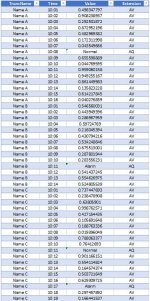
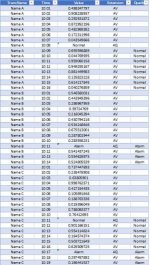
There are many steps to in this process including delimiting, merging tables, and combining rows, which must be completed in order to meet the format requirements of 2) above. All seems to be working well except for the "combining rows" portion. This process works well (functionally) but takes incredibly long to load to the data model. The initial file I am starting with is 220,000 rows and takes about 8 hours to load to the model. The eventual use (if I can work out the speed issues) will be to process files with several billion rows (as many as I can possibly process). Here is the step which is taking all the time:
=if Record[Groups.Extension]{[Index]-1}="AQ"
or from the Advanced Editor:
I understand why this is taking a long time to process (it is iterating through all rows multiple times to look backwards at indexed values), but I don't know what to do about it. I am currently running it on Win 7, Excel 2013 32 bit, with 8GB RAM. I can get access to a system with multiple processors, >1TB RAM and 64bit Excel, but I am unsure if this will improve my processing time.
My two questions are as follows:
1) will increasing RAM, number of processors, and speed of processors dramatically improve my performance, or will the effects be very small?
2) is there a better way to accomplish my process without the backward looking index which is taking so much time?
Any help is greatly appreciated.
I am using PowerQuery to migrate data from one database into another. To make a long story short, the requirements of this migration are:
1) The existing database can only export to .csv files
2) The new database uses a "flat file importer" to import data, and the flat files (.csv) must be of a very specific format and contain data not present in the original database
There are many steps to in this process including delimiting, merging tables, and combining rows, which must be completed in order to meet the format requirements of 2) above. All seems to be working well except for the "combining rows" portion. This process works well (functionally) but takes incredibly long to load to the data model. The initial file I am starting with is 220,000 rows and takes about 8 hours to load to the model. The eventual use (if I can work out the speed issues) will be to process files with several billion rows (as many as I can possibly process). Here is the step which is taking all the time:
=if Record[Groups.Extension]{[Index]-1}="AQ"
and [TruncName] = Record[TruncName]{[Index]-1}
then Record[Groups.Value]{[Index]-1}
else
if Record[Groups.Extension]{[Index]-1}="SQ"
and [TruncName] = Record[TruncName]{[Index]-1}
then Record[Groups.Value]{[Index]-1}
else null
then Record[Groups.Value]{[Index]-1}
else
if Record[Groups.Extension]{[Index]-1}="SQ"
and [TruncName] = Record[TruncName]{[Index]-1}
then Record[Groups.Value]{[Index]-1}
else null
or from the Advanced Editor:
let
Source = Csv.Document(File.Contents("C:\Users\beagl\Desktop\PreProcessed1hPIData.csv"),[Delimiter=",", Columns=9, Encoding=1252, QuoteStyle=QuoteStyle.None]),
#"Promoted Headers" = Table.PromoteHeaders(Source, [PromoteAllScalars=true]),
Record = Table.AddIndexColumn(#"Promoted Headers", "Index", 0, 1),
#"Created Quality Attribute" = Table.AddColumn(Record, "Quality", each if Record[Groups.Extension]{[Index]-1}="AQ"
and [TruncName] = Record[TruncName]{[Index]-1}
then Record[Groups.Value]{[Index]-1}
else
if Record[Groups.Extension]{[Index]-1}="SQ"
and [TruncName] = Record[TruncName]{[Index]-1}
then Record[Groups.Value]{[Index]-1}
else null)
in
#"Created Quality Attribute"
I understand why this is taking a long time to process (it is iterating through all rows multiple times to look backwards at indexed values), but I don't know what to do about it. I am currently running it on Win 7, Excel 2013 32 bit, with 8GB RAM. I can get access to a system with multiple processors, >1TB RAM and 64bit Excel, but I am unsure if this will improve my processing time.
My two questions are as follows:
1) will increasing RAM, number of processors, and speed of processors dramatically improve my performance, or will the effects be very small?
2) is there a better way to accomplish my process without the backward looking index which is taking so much time?
Any help is greatly appreciated.


