Synchronization a la FORECAST

virtualdynamo

New member
Joined
Jan 16, 2022
Messages
14
Reaction score
0
Points
0
Location
Kansas City, MO
Excel Version(s)
Microsoft 365 MSO
I have 2 sources that record every second that I need to merge. Unfortunately, the clock in one of the devices loses about 5 seconds over the course of a 12+ hour test. Interpolating would be fine, but unwieldly for 40,000 records in Excel using FORECAST. Can anybody think of a better way to do this within Power Query? FWIW, there are 4 fields from this slow source I'd be interpolating.
 
I'm not sure how you'd use FORECAST to interpolate - a few more details perhaps?
My thoughts are that if the 5 seconds loss over 12 hours is a continuous thing (it doesn't happen because of an occasional glitch or glitches in the timer) then you can apply a correction by adding/subtracting a constant value for each record dependent on the (incorrect) time. This correction would be of the order of 2.7 x10[SUP]-9[/SUP] seconds for each second elapsed. Since Excel expresses time as a fraction of a day this translates to about 3 x 10[SUP]-14[/SUP] which is getting close to the number of digits Excel calculates to, but it's probably close enough. Having applied the correction to the appropriate data set (in Power Query or on a sheet), you could place the data sets one above the other (append in PQ terms) and sort them.
You'd have to convert the times to decimal initially but you can easily convert the decimals back to time afterwards. Even if the times end up showing (or being) to the nearest second, they would still be in the correct order.

Perhaps attach (or link to) a couple of datasets you want merging so we can experiment?

(What format does the device output the time as? Hopefully with values including fractions of a second. If not then the corrections might need to applied by row number rather than as a function of the (incorrect) time.)

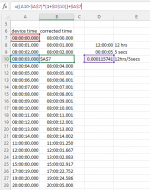
Example of device time versus corrected time:
Cell B10 is is being edited in the pic. Note how after 12 hours there's 5 seconds added to the last time.
2022-02-22_164013.png
 
Last edited:
As to how to use FORECAST for interpolation, see the attached artificial case. In this case, there are 2 recording instruments. A "slow" one that is measuring a simple sine wave and a "precise" one (whose measurements aren't included). Each one wants to record every 2 seconds to get 180 samples in a complete cycle. However, the slow device only manages to take 179 samples in a cycle. I predict the actual points in time using a technique similar to what you've described. However, since I'm merging, not appending, with the "precise" source, I need to predict the "slow" measurements at those precise 2 second intervals.

Not germane, but the slow device records the timestamp as text. e.g. "2021-12-14T14:45:12Z". The precise device records its timestamp as an uint32 that represents the number of seconds since midnight on December 31, 1989 UTC.
https://developer.garmin.com/fit/cookbook/datetime/
 

Attachments

  • Forecast.xlsx
    36.2 KB · Views: 2
If speed is your main concern, then a macro/VBA solution will be quickest. Macros OK?

If you want on-the-second values generated, realise that if the slow device is 5 seconds slow after 12 hours then there'll be 5 fewer readings from that device than from the accurate device, so we'll have to be cleverer than just FORECASTing the previous 2 readings.

Give me some realistic data to work with (you say you have 4 fields), with actual times rendered by both devices. It's hard work providing a solution for theoretical data only to have to change it for real data.
 
Last edited:
Thanks for your continued assistance.

Speed is of no concern. Synchronization is the only concern. I'm very (nearly categorically) opposed to VBA.

I'm fully aware of the different number of records over the course of the experiment. That's really the issue. Indeed, with the 5 fewer records, I'll have to "shift" the FORECAST function 4 times over the course of the experiment. The real files are too large to attach. I'll try to pare them down, but I think it'll be harder to comprehend the challenge. First I'll revise the artificial case for a 5 second "loss" with an illustration of the "problem". It'll be tomorrow at the earliest for either.
 
Here's an updated FORECAST spreadsheet where I have both hypothetical measuring instruments. I've also revised the experiment. The instruments attempt to record every second. The object being measured has a diameter of 1 and completes a revolution in 72 seconds. The slow instrument is measuring the y-axis position and it is found that only 67 intervals have taken place after a full revolution instead of the expected 72. The precise instrument is measuring the x-axis position.

Reference the Slow sheet: Using the XLOOKUP (column G), with 1 more row in the range than time lost. Then I use the result with INDIRECTs to construct the known_ys and known_xs for FORECAST.LINEAR (column H). This allows me to do the interpolation with the same formula for every row. (I had to insert some faux data rows at the top to prevent invalid REF!s.)

Reference the Analysis sheet: By Pythagorean's Theorem, the sum of the squares of these two measurements should always be 1. The uncorrected column B/blue line does not. The corrected (synchronized) column C/orange line does that with an error never exceeding 0.2%.

While I've answered my own question, I'd still like something more elegant and something within Power Query. The source files are CSVs. From within Power Query, I want to pick the date of the experiment and Power Query take it from there.
 

Attachments

  • Forecast.xlsx
    47.4 KB · Views: 2
Attached is a ZIP file of the pared down real CSV data files. Also attached is a PDF of the algebra of the project. I have included enough data for the denominator of the final equation. Vair (wind_speed) and rho (Air dens) come from columns B and D of the Velocomp file, respectively. V (record_speed) comes from column B of the record_data file. Comparisons of the wind_speed and record_speed values is how I determine time error. Note that several transformations must be performed on the timestamp (I also do some unit conversions) on the Velocomp file before merging. Below is the PQ code to do this in my unabridged source.

Code:
let
    Source = #"AP-read",
    #"Removed Top Rows" = Table.Skip(Source,4),
    #"Promoted Headers" = Table.PromoteHeaders(#"Removed Top Rows", [PromoteAllScalars=true]),
    #"Removed Other Columns" = Table.SelectColumns(#"Promoted Headers",{"Speed (km/hr)", "Wind Speed (km/hr)", "Timestamp", "Air Dens (kg/m^3)"}),
    #"Renamed Columns" = Table.RenameColumns(#"Removed Other Columns",{{"Speed (km/hr)", "AP.speed"}, {"Wind Speed (km/hr)", "AP.wind_speed"}, {"Timestamp", "AP.timestamp"}, {"Air Dens (kg/m^3)", "AP.air_dens"}}),
    #"Replaced Value" = Table.ReplaceValue(#"Renamed Columns","Z","",Replacer.ReplaceText,{"AP.timestamp"}),
    #"Changed Type" = Table.TransformColumnTypes(#"Replaced Value",{{"AP.speed", type number}, {"AP.wind_speed", type number}, {"AP.timestamp", type datetime}, {"AP.air_dens", type number}}),
    #"speed km/hr->m/s" = Table.TransformColumns(#"Changed Type", {{"AP.speed", each _ / 3.6, type number}}),
    #"wind_speed km/hr->m/s" = Table.TransformColumns(#"speed km/hr->m/s", {{"AP.wind_speed", each _ / 3.6, type number}}),
    #"timestamp ->XL" = Table.TransformColumnTypes(#"wind_speed km/hr->m/s",{{"AP.timestamp", type number}}),
    #"timestamp XL->Garmin" = Table.TransformColumns(#"timestamp ->XL", {{"AP.timestamp", each (_ - 32873)*86400, type number}}),
    #"Changed Type2" = Table.TransformColumnTypes(#"timestamp XL->Garmin",{{"AP.timestamp", Int64.Type}})
in
    #"Changed Type2"
 

Attachments

  • 12_14_2021 - XLGuru.zip
    604.1 KB · Views: 2
  • CdA open-loop.pdf
    60.3 KB · Views: 2
Comparisons of the wind_speed and record_speed values is how I determine time error.
So how do you do that? Just so I can try to incorporate that into a solution.
Are the two csv files you attached each a single (continuous?) recording (I see some gaps)? If so I think the most accurate way to work out both (a) the factor to apply to compensate for slowness and (b) an absolute subtraction/addition to apply, is to find a pair of corresponding records near the beginning of the recordings, and the same towards the end of the recordings. It would be then a matter of a bit of arithmetic to apply time corrections to one of the record sets.

After that I think I'll be able to 'merge' these, very likely in PQ. I'll explore that in the meantime anyway, determining corresponding timestamps manually.

Is there any chance you could upload these 2 text files to a file sharing site and share a link to them? That is, the raw data as they come from the devices because (1) you can upload larger files there and (2) I'd like to see un-pared-down files (I'm guessing you did the paring down in Excel and then saved as csv from within Excel; past experience tells me that Excel mangles these files) and I'd prefer to get Power Query to fetch the data directly from raw text files. It also means any solution I offer is more likely to work out-of-the-box.

As an aside; are we talking wind turbines?
 
I've got to the stage where I'm able to create a table of the Slow data with good corrected timestamps. This en route to merging the two tables.
The attached (linked to) file has a very busy sheet, most of which can be deleted but it'll show my workings.
First I brought in the two tables directly from the 2 text files in your zip file (obviously, you'll need to tweak the queries to point to where the files are on your system). The first table is largely your m-code.
To find corresponding times in both data sets I plotted in charts what you said you used to 'determine time error': wind_speed and record_speed. I plotted these on two separate xy-scatter charts (see them in the vicinity of cell O1) and moved/stretched/overlaid them so as to line up the troughs in both. Then I hovered over coresponding points on each, which pops up the coodinates which gave me a good idea where to look in the two tables.
I put these values in the red-shaded cells F2:F3 and P2:p3 and gave these single cells Names (it's easy to bring them in to Power Query). (I also put start and end in columns E and N so you can quickly jump to these rows.)
First I wanted to devise a formula on the sheet to calculate the corrected timestamps, see cell I2 which does this. The cells below I2 contain plain values (I copy|pasted values in situ not to lose them), but if you copy down that formula you'll get the same values.
The formula is:
=(Table4[@[record.timestamp'[s']]]-SlowStart)*((AccurateEnd-AccurateStart)/(SlowEnd-SlowStart)-1)+Table4[@[record.timestamp'[s']]]-SlowStart+AccurateStart
which is probably more convoluted than it need be - seeing your pdf file suggests to me you'd be better at rearranging formulae then I. Here it is condensed to a more readable form:
=(AA-SS)*((AE-AS)/(SE-SS)-1)+AA-SS+AS
maybe you can come up with a more elegant one.
Then I translated that formula into PQ steps whose result is in column J. We can ditch the record.timestamp column later.

To get an idea of how good or bad this process is I plotted both data sets on the same chart (near cell O38). I stretched it out wide to try and see correlation.
What's quite neat with this is that you can manually tweak some of the values in the red-shaded cells, refresh the second table and this chart updates itself, by which you can improve your timestamp corrections.

Tomorrow, on to merging these two tables…

The file: https://app.box.com/s/t25rqxgavk7r86qxlnkz41xp6wyd962z
 
Last edited:
Wow! You've put some quality time into this. I'll try to digest it ASAP. For now, I'll "just" answer your aside.

The application is field determination of the coefficient of drag x cross sectional area of a bicycle and rider. Velocomp's AeroPod is marketed as a device to do that in real-time. (Currently, I find that claim to be dubious. This has caused me to learn Power Query and means I don't ride my bike as much.) The AeroPod is the "slow" device. My other instrument is a Garmin Edge 1030 Plus. Since this device is a GPS, I consider its timestamp to be precise gospel. (So I warn you not to "ditch the record.timestamp column".) My work is rooted in the Virtual Elevation technique developed by Dr. Robert Chung.
http://anonymous.coward.free.fr/wattage/cda/indirect-cda.pdf
This particular experiment is from a ride I did on December 14, 2021. During this ride, I alternated between laying in the aerobars and holding the brake hoods. So this long data stream includes several experimental runs. The start and stop of an experimental run is denoted by a lap marker in a third CSV. This file also came from the GPS (and has a gospel record.timestamp column too.) I'm able to attach the unabridged version of this lap_data file.
https://www.strava.com/activities/6385440166
 

Attachments

  • 2021-12-14-08-34-06-lap_data.zip
    17.4 KB · Views: 2
Another aside: Since the Garmin and the Aeropod are both ANT+, can you not connect the two, either directly or through an app, then your synchronisation problems would be over?!
I don't know what I'm talking about but I came across this: https://www.thisisant.com/directory/edge-1030-plus/ where if you filter for Aeropod you get to a page about the AeroPod CdA - CIQ APP at https://www.thisisant.com/directory/aeropod-cda-ciq-app/ which in turn took me to https://apps.garmin.com/en-US/apps/f5420d3a-a9b7-4ef8-ae4d-463f3504b1e2 . There's also something called Garmin connect-iq https://developer.garmin.com/connect-iq/compatible-devices/ which I'm guessing you install on a smart phone?
 
You're really getting down in the weeds (and their rabbit holes) with me! We should really chat on the phone (or a ride).

<ANT+>
But wait! There's more! On long rides, I ride with 2 GPSs of differing models. (Why? Get familiarized with the Transcontinental Race (TCR).) Currently, that is a Garmin Edge 830 and 1030 Plus. The 830 has the AeroPod CdA - CIQ APP installed. This app serves up 4 fields: CdA, Wind, Slope, and Time Adv. There are 3 ANT+ networks:
  1. AeroPod (AP). Connected devices: speed sensor, power meter (DFPM).
  2. Edge 830: Connected devices: speed sensor, AP, heart rate monitor, Di2 electronic shifting.
  3. Edge 1030 Plus: Connected devices: speed sensor, DFPM, heart rate monitor, Di2 electronic shifting.
The AP has many issues. The one I've got them to acknowledge is losing communication with the DFPM. Here's a forum post on the matter. Subsequently, they've elected to engage me off-line via e-mail.
https://velocompforum.com/viewtopic.php?f=98&t=5826
Yes, if I could write my own IQ App AND read air (not wind) speed, elevation, air density, and (relayed) DFPM fields from the AP, AND get the GPS to record these fields, I'd have single data acquisition device and then my "synchronisation problems would be over?!" However, I've never written an IQ app and have my doubts if the others are possible.
I have installed the Garmin SDK on my Win10 notebook (now Win11, I wonder if it still works). I did this so I can take the native FIT file from the Garmin GPS and have the SDK generate the record_data and lap_data CSV files. In the event you want to go this rabbit hole that goes all the way to China, I've attached a ZIP with that FIT file.
</ANT+>
 

Attachments

  • 2021-12-14-08-34-06.zip
    1.2 MB · Views: 2
Have I added corrected timestamps to the wrong data set then?

I have yet to digest your work, but given:
  1. The record_data and lap_data CSV files are already synchronized.
  2. The CdA equation has several delta t terms and integers (especially the number 1) are inherently easier to handle.
It's best that the merged data set be in exact (1) second intervals. The record.timestamps is that natively.
 
So how do you do that?

Note the addition/subtraction I've added after 86400 below.
Code:
#"timestamp XL->Garmin" = Table.TransformColumns(#"timestamp ->XL", {{"AP.timestamp", each (_ - 32873)*86400+4, type number}}),
That allows me to shift the AP data back and forth in time.
<StreamOfConsciousness>
Calculate the ratio of AP/GPS speed. Study 11 snipets of 100 records each. Note STDEV.S for each snippet as time shift is varied. Regress on minimized STDEV.S.
</StreamOfConsciousness>
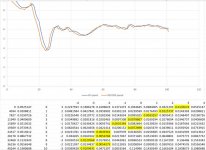
Your query has caused me to complete this analysis rather than shoot from the hip. In reality, I find the AP loses 5.96 seconds over the 11.7 hours of data it gave me.

AP Time Synch.jpg
I really need to get with the program and file share . . .
 
Here is a public link to a Google Drive folder that serves as a repository for my unabridged work on this subject. The PQ in the CSV file includes GPS-lap-read, GPS-record-read, and AP-read queries. Changing the filepath in the Source step of each of these queries should be all it takes to get this XLSX to work locally.
https://drive.google.com/drive/folders/1EnW61jthSizVkbDnjZ8tbqkc76Qy5PcG?usp=sharing

Are the two csv files you attached each a single (continuous?) recording (I see some gaps)?

Yes, the AP has some gaps. Of the 39376 intervals, there are 21 that are not 1. Experimental runs that include such gaps will be excluded from subsequent study. (Any experimental runs that have lost communication with the DFPM will also be excluded.)

Have I added corrected timestamps to the wrong data set then?

My interpretation is yes. You've corrected the timestamps for the precise GPS.

=(AA-SS)*((AE-AS)/(SE-SS)-1)+AA-SS+AS

A little algebra will simplfy this to the standard interpolation equation of:
=(AA-SS)*(AE-AS)/(SE-SS)+AS
 
I'm not at alll clear on how I might find corresponding start and end points in the 2 datasets. In the absence of that understanding I pressed ahead with trying to get what you want using the manually entered start and end points in red-shaded cells on the sheet. So in the attached:
I've changed which dataset has the corrected time stamps. See Sheet2. I've changed the names of those points to GarminStart, GarminEnd, APStart and APEnd. The corrected time stamps are in column M and it's the work of the Velocomp_12_14_2021_0845_250_km - XLGuru (2) query.
Again, there's a chart at cell P13 to check on correlation.

Moving onto the Append1 sheet.
At cell K71374 there's a small table called AreWeLucky from the query of the same name which I hope is the kind of thing you're looking for. The first three columns are (almost) direct from the Garmin data. The last three columns are interpolated data from the AP dataset.
I've kept the table small because it takes an age to refresh. It's enough to test the idea and to check it's what you want. If it is correct and it is what you want then I'll have a go at making it faster.
It's at that position on the sheet beacuse it's next to similar data in the table (called Append1 too) on the left on that sheet, which will need some explaining:
First, it's not necessary, it's just for a visual check during development.
It's actually what I thought you wanted in your first message here; I appended the Garmin table to the time-corrected AP data then sorted on the timestamps.
The rows from the Garmin dataset are are labelled as such in column D (Source). The yellow cells in table Append1 would normally be blank but I've put some formulae in them to fetch the data from the AreWeLucky table on the right. This is so you can check a few sample interpolated values. I deliberately chose an area where the data from the two sets didn't interleave regularly so that you can see how it deals with that.

You can expand the AreWeLucky table to include all the data by removing the step Filtered Rows in that query. I haven't tried it yet because I think might take all night!

There are 6 queries and one function in the attached, several are not needed; I'd expect only 2 or 3 queries and one function in the final version. It could even be just one query, but I wouldn't like to have to edit that one!

The file: https://app.box.com/s/mpyooje3v5jfukzu17785qmys9ak2ap6
 
I really appreciate your help. Your questions and hints have helped me make genuine progress. I think the spreadsheet I posted on my Google Drive is farther along than your current work. Going forward, I'm going to split my spreadsheet in 2. The first will merge the AP and record_data files, ascertain the timestamp errors the AP source, interpolate AP's air speed, air density, and elevation values "on the second", and then re-merge with record_data. This output will then be merged with the lap_data file for additional calculations and aggregation in another spreadsheet. It'll be a few day before I have anything additional to share.
 
Does 2021-12-14-08-34-06-lap_data.csv come from the same device as 2021-12-14-08-34-06-record_data.csv? For example, do the raw data timestamps correspond exactly in these two files?
[Edit post posting. Don't bother answering that, you already did in msg#10]
 
Last edited:
[Edit post posting. Don't bother answering that, you already did in msg#10]
Acknowledged. But to give a more complete picture . . .
  1. An AeroPod creates an IBR binary file. Velocomp's Isaac software exports the Velocomp*.CSV file.
  2. A Garmin Edge creates an FIT binary file. Garmin's SDK includes some magical java batch files to create CSV files of various flavors from a FIT file. I use the FitToCSV-data.BAT and FitToCSV-record.BAT to create the respective *_data.CSV files. There's also the "kitchen sink" FitToCSV.BAT that (I assume) produces a CSV that's the stream of data as it records it binarilaly (is that a word?). This kitchen sink CSV includes everything that the *-record_data.CSV and *-lap_data.CSV (and more), but is quite unwieldly.
I've added the December 14, 2021 binary files as well as the kitchen sink CSV to that shared Google Drive folder.
 
Back
Top