Nested BOM structures that exist in only 2 columns in the db

jjsararas

New member
Joined
Sep 25, 2019
Messages
12
Reaction score
0
Points
1
Excel Version(s)
2016, 365
I'm looking for some ideas to deal with nested BOM structures, and how to get forecast quantities to flow through properly. I have a finished product- the X10000, which is made of components, and some of the components also have structures of their own. So effectively, a 'Component' at one level, is a 'Parent' at the next level, and so on. This nesting goes 3 levels deep. The trick is my table in the database is only 4 columns: Parent, Component, Qty, Desc, with the same SKU appearing in multiple places at multiple levels. I need to apply a forecast quantity for the finished product (The X10000), and have it flow through and apply the multiplier through all components in order to plan resources. I've attached an Example.xlsx laying out my db table structure along with a visual representation of the 'actual' nested structure. Thanks in advance!
 

Attachments

  • Example.xlsx
    13.3 KB · Views: 47
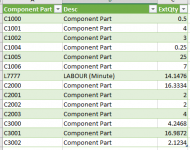
Are you looking for a result set similar to the following that shows the number of end components necessary to make the final product?

ComponentsResult.PNG
 
Cyborgski, yes that's exactly what I'm after. I'm imagining how to maybe build reference queries off of the db table query, and then nesting one after the other to run the calculation through each step of each structure. My (limited) experience with Power Query is that things get slow really quickly with multiple queries, although there are only about 40,000 records in this table.
 
Hi jjsararas ,

You may want to analyze consumption for multiple goods at the same time. The attached workbook would allow you to place multiple parts into the Forecast table. The Consumed query performs the following on refresh:

1) Read the forecast table
2) Travel the BOM (nested join) for up to the number of levels specified by MaxLevels (currently set to 16 - you may need to set higher until you find that the final column has all nulls).
3) Calculate the consumption by multiplying the qty values
4) Look for the last part number on each line (this part is the one that is consumed).
5) Summarize qty by Part and the consumed part

I do not have any BOM data to validate the speed of the attached code. If it is slow, try putting the BOMCodeIfSlow query in place of the BOM query. I find setting a key will speed up PQ. Just be sure that your BOM data is unique on Parent and Component Part.

Good luck,
Mike
 

Attachments

  • ExampleBOMTravel.xlsx
    24.7 KB · Views: 17
Amazing. I'm going to spend the afternoon deciphering the M code. Thanks so much Mike. Knowing there are people like you out there willing to share knowledge is very encouraging.
Jeff
 
AhI've been coming across this magical 'List.Accumulate' in my studies, figuredit might play in here! I attached my recursive merge method just to showeffort … but I'm now realizing I need to also sum the 'CP'Parent/Component parts, since those numbers will affect other things (namelywarehouse allocation for those intermediary pieces). I suspect I'll need tocompletely rethink the AddConsumedPart step, as it looks like it's pulling the'latest' values in the row. Any hints?
 

Attachments

  • BOMTravel.xlsx
    30.3 KB · Views: 8
  • Example.xlsx
    13.3 KB · Views: 9
Hi Jeff,

Are you trying to implement MRP in Power Query?

I have attached an alternate vertical structure that leaves the intermediate pieces in place. Because of the change in structure, I opted to put in a List.Generate version. It will be more efficient then List.Accumulate as it can determine when to stop looping. I did leave a List.Accumulate version for transition. I also pushed the looping logic into an inline function for readability. I hope that this structure is more effective for your needs.

Regards,
Mike
 

Attachments

  • BOMTravel.xlsx
    32.5 KB · Views: 26
I am doing just that. The general idea is to attempt to work out all the logic in PQ, then build the required Views in the (SQL) database to help shift some of the load, and then come back and simplify the PQ.

I'm attempting to unpack the code and struggling to understand the Recur function - you define a parameter input as parenttable, but then in the TravelBOM step, there's no parameter supplied to in within the List.Generate. How does it know what table to merge?
 
Last edited:
The formula = List.Generate(()=> #"Renamed Columns" ,each not Table.IsEmpty(_), Recur) is the same as = List.Generate(()=> #"Renamed Columns" ,each not Table.IsEmpty(_), each Recur(_)).

The third parameter (each Recur(_)) to List.Generate takes the prior list element and transforms it to the next list element. In this example, the table #"Renamed Columns" is the first element and is joined to the BOM table. If that result is not empty (the second parameter in List.Generate is each not Table.IsEmpty(_)) then take the result (aka the new second element) and join to the BOM again. If that second result is not empty then take the second result (aka the third element) and join to the BOM again. The loop will continue until the join returns an empty table.

In the BOMTravel workbook from the prior post, you can see the four tables created by clicking on the List.Generate.


Hope this explanation helps,
Mike
 
Yes it helped a lot, thank you! I've gone and reverse engineered Recur into separate functions so I could follow it through. I also added a List.RemoveFirstN step over TravelBom to remove the seed table and leave only the consumed parts. I'm on to figuring out how to augment the existing historical MRP #s week by week. Your help here has taken me a long way, thanks again Mike!
 
Back
Top