Hi there,
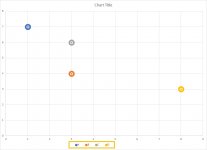
I am working with a rather large set of data and am trying to figure out the best way to make a scatter chart with all of my data, along with having the each as a new series, thus being able to have indvidual labels in the legend.
An example of the data is --
With the corresponding XY scatter plot as so

Is there an easy way to have multiple series in a plot, without having to do it manually?
Sorry if this isnt clear, just ran into this issue and am going brain dead - yay for data analysis!
I am working with a rather large set of data and am trying to figure out the best way to make a scatter chart with all of my data, along with having the each as a new series, thus being able to have indvidual labels in the legend.
An example of the data is --
| Label/New Series | X | Y |
| A | 1 | 7 |
| B | 3 | 4 |
| C | 4 | 6 |
| D | 8 | 3 |
With the corresponding XY scatter plot as so

Is there an easy way to have multiple series in a plot, without having to do it manually?
Sorry if this isnt clear, just ran into this issue and am going brain dead - yay for data analysis!


