reidgood50
New member
- Joined
- Apr 11, 2017
- Messages
- 2
- Reaction score
- 0
- Points
- 0
Hello,
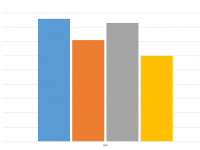
I am trying to create a clustered column graph where certain columns overlap but not all of them. I have four different locations that each need two overlapping fields graphed. I can add these fields but when I try to overlap the columns, they all want to overlap.
Does anyone know how to chose which columns overlap in this type of graph?


