I have created a few pivot tables, but this one has me stumped.
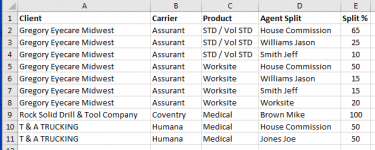
Below is my sample data:
(This is my first post, didn't see how to make images larger to begin with)

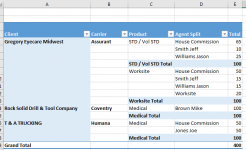
I can create the pivot table by client:

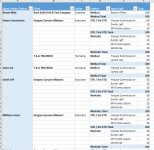
But I want to create it by agent.
If you make the agent column A you can't get to 100% for the split because you loose the other agents involved in the product split.
The only way I can see how to do it, involves duplicating the data for each agent making my spreadsheet nearly 200,000 rows.
Is there another way to create the pivot table so it looks like this, given the data I have? Your help is greatly appreciated.

Below is my sample data:
(This is my first post, didn't see how to make images larger to begin with)

I can create the pivot table by client:

But I want to create it by agent.
If you make the agent column A you can't get to 100% for the split because you loose the other agents involved in the product split.
The only way I can see how to do it, involves duplicating the data for each agent making my spreadsheet nearly 200,000 rows.
Is there another way to create the pivot table so it looks like this, given the data I have? Your help is greatly appreciated.


