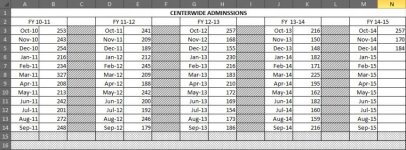
I have a previously built chart where the data was all displayed in one column for labels and one for data. I've moved the data to a different format so it's easier to read and edit. When i try to change the data source it either funks up the chart or it gives me a single cell, column or row error. I'm trying to achieve the look of the chart linked and I've added a link to the old data setup and the new data setup. I would really appreciate some guidance as to where I can find how to correct this issue.
Working Chart

Old Data format

New Data format

Working Chart

Old Data format

New Data format


