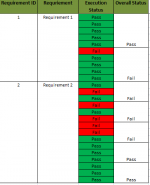
I wanted some help in excel as i have low expertise in it. Below is a screenshot of my data for which i need to add a formula in generating a graph.
I have four columns in an excel:

Can someone help me out in this?
I have four columns in an excel:

- Execution status dropdown has values "Pass" or "Fail". Based on the values selected here i using a formula to generate 'Overall status" (Formula used = =IF(COUNTIF(J2:J14, "Pass")=, "Pass", "Fail").
- Now, i wanted to generate a chart for Requirement and OVerall status column. This is something that im not able to do.
Can someone help me out in this?

