Hi
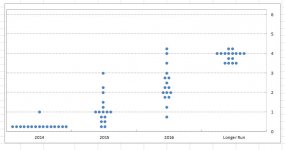
I'm an Excel novice and have been asked to help create a graph like the one in the attached image. I've done online searches and it seems this is a scatter plot graph with groups. However, the x axis needs to have categories and not numbers, and it seems the x axis on a scatter graph has to be numbers. Is it possible to use Excel to create a graph that will look like the attached image?
Thank you in advance for any help
Melissa


